
| Verified against primary record | |
| Aviation’s share | Approximately 2 per cent of global carbon dioxide emissions, for all aviation[1] |
|---|---|
| Altitude effects | A 1.7 multiplier is applied to account for the radiative forcing effects of emissions at altitude[2] |
| One health system’s travel share | Patient, staff and visitor travel around 14 per cent of system emissions, 5 per cent for patients[3] |
| Records read | An aviation body page, a treaty document, a government methodology, a health system plan and two studies, 9 October 2026 |
| Independently reported | |
| Patient travel, one country | 35.7 megatonnes of carbon dioxide equivalent a year, 95 per cent interval 27.5 to 43.9[4] |
| Bands apply only to the rows beneath them. Every figure here is for aviation generally or domestic patient travel; none is a medical tourism figure. | |
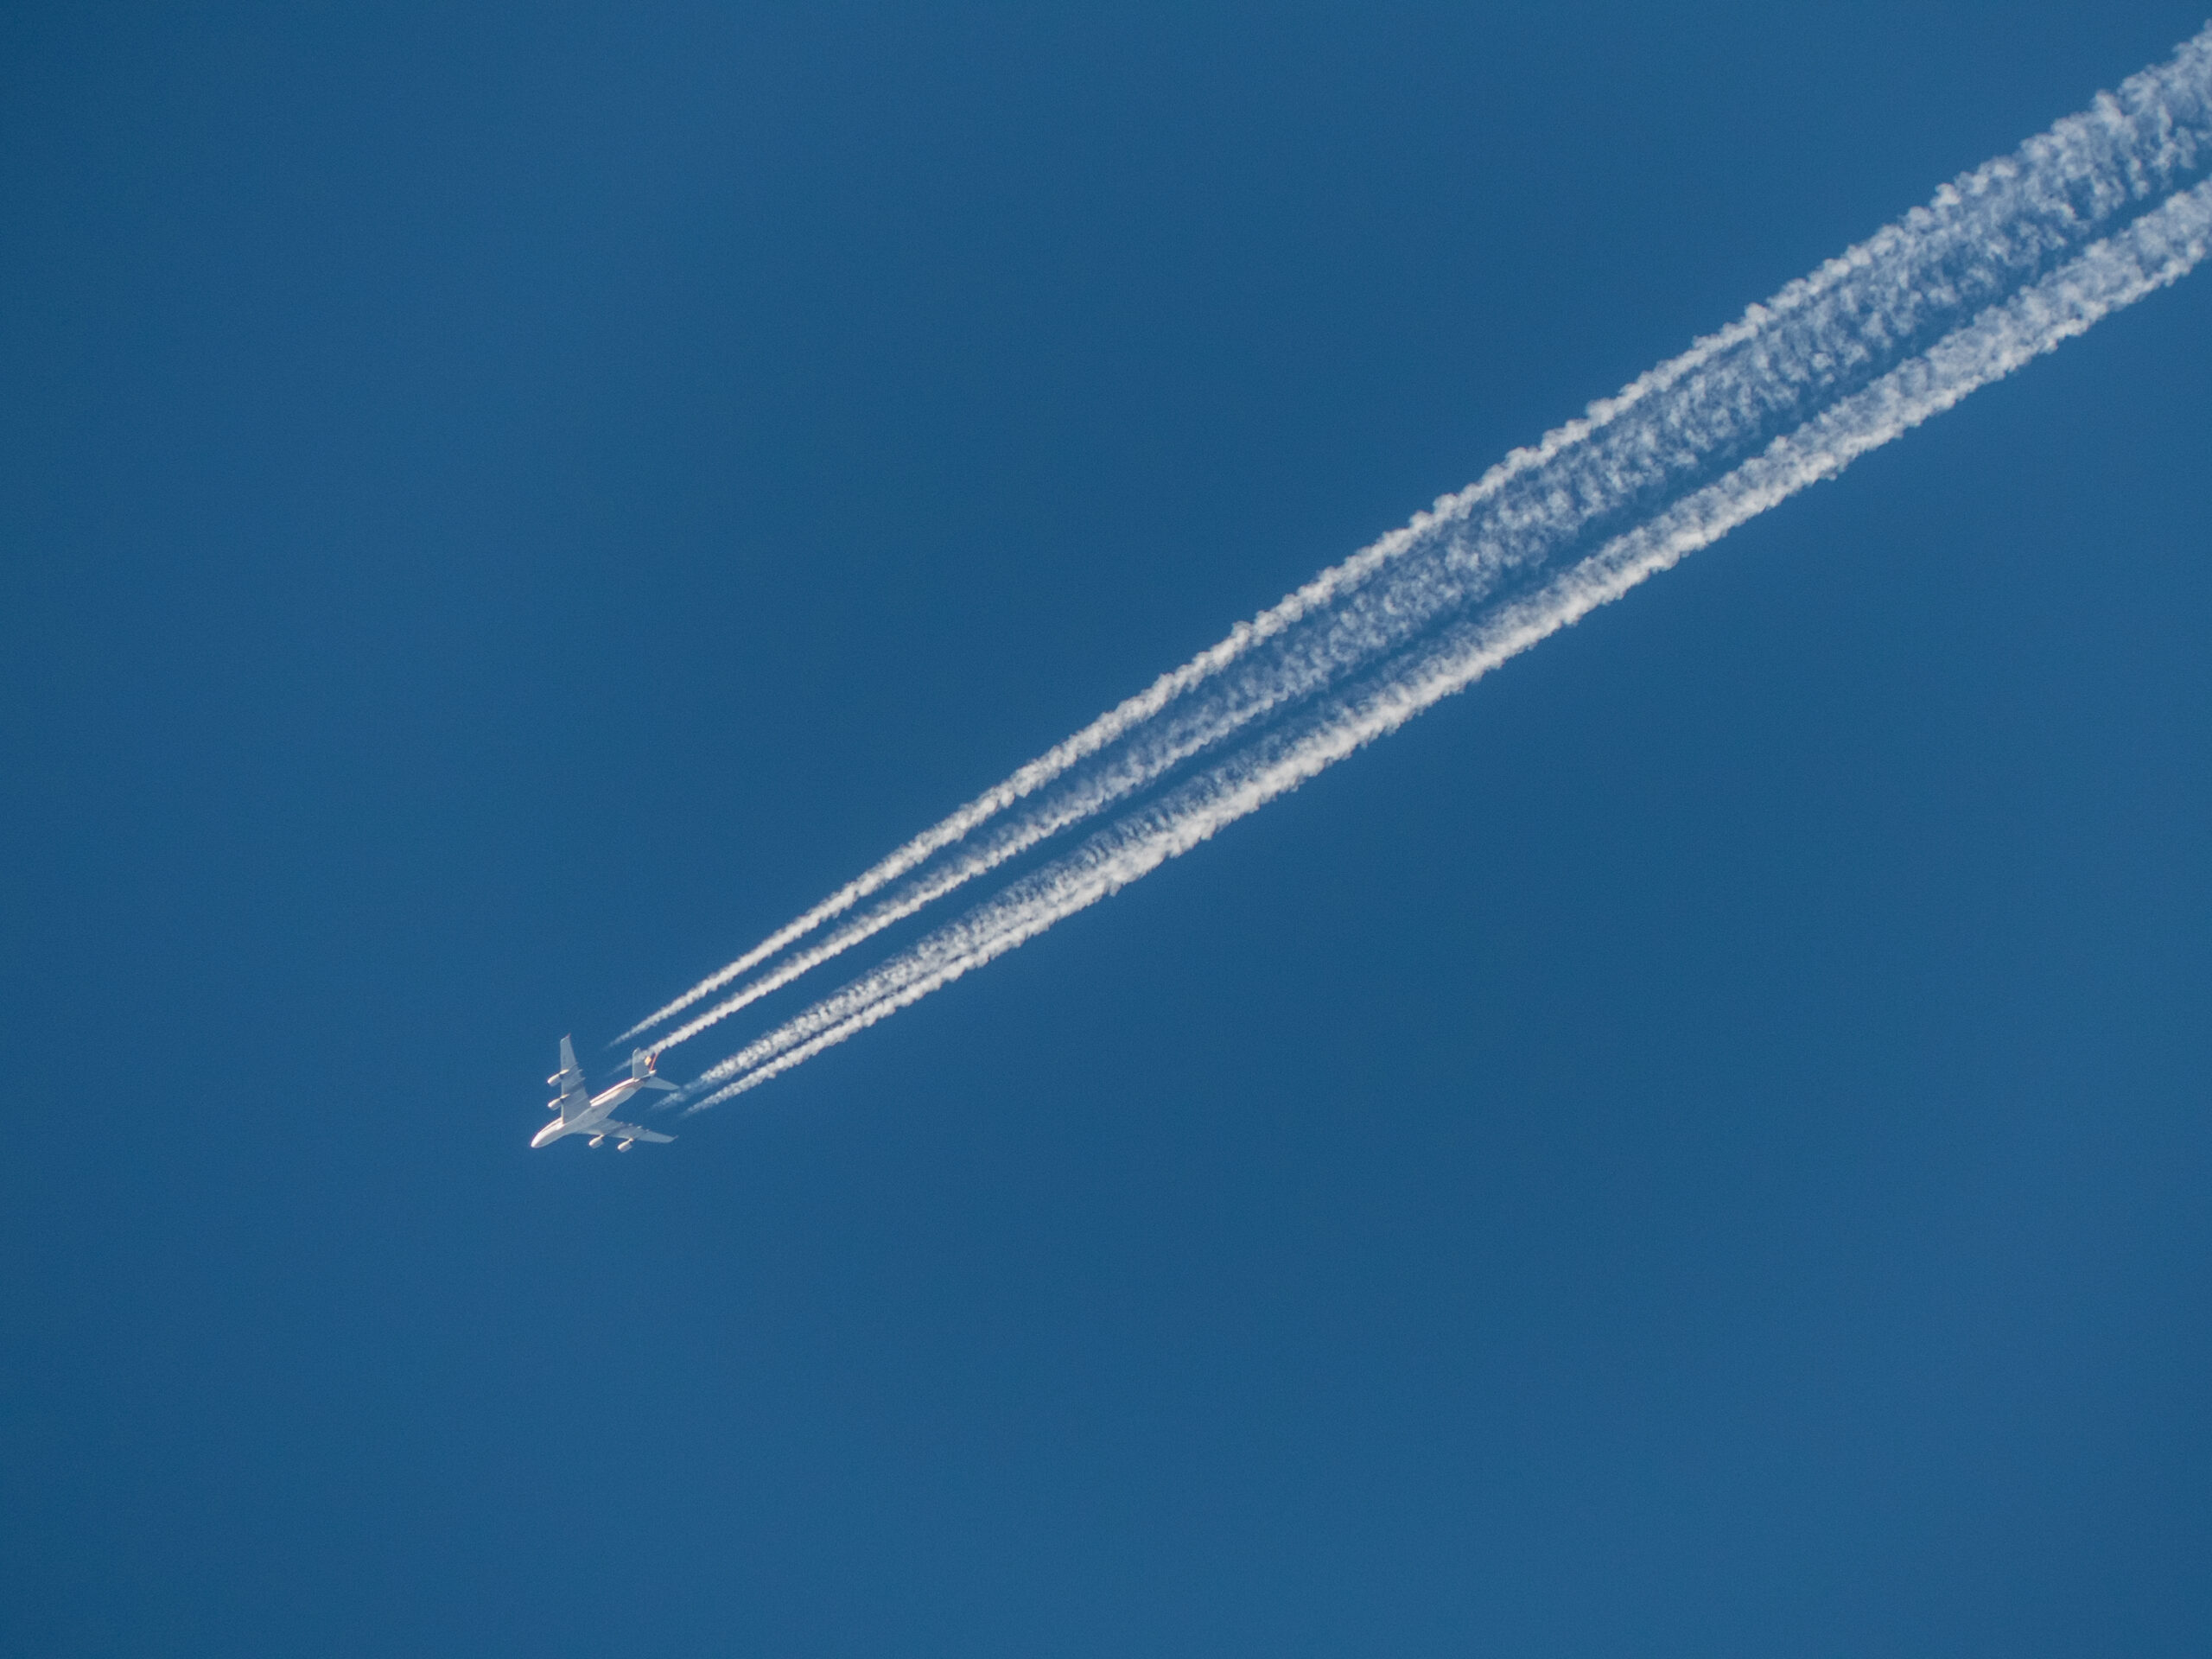
Medical tourism and environmental sustainability is a question that can be posed precisely and has not been answered. Medical travel combines a long-haul flight with a hospital episode, and both are measurable. No study estimating the greenhouse gas emissions of medical travel as a distinct category was located for this entry.
The aviation side
The international aviation body states that aviation is estimated to be responsible for approximately two per cent of global emissions of carbon dioxide, that international operations are roughly 65 per cent of total aviation emissions, and that net annual carbon dioxide from international operations was 448 megatonnes in 2010.[1]
Three conditions belong with those figures. The 2 per cent is all aviation, not international aviation, and the 65 per cent is a share of aviation rather than of global emissions, so the two should not be multiplied carelessly. The 448 megatonne figure is for 2010 and is badly out of date. And the page carries no publication date and attributes the figures to no named study. A separate statement, reproduced in a treaty document, records an aviation assembly resolution describing international aviation emissions as currently accounting for less than 2 per cent of total global carbon dioxide emissions; that wording dates from a 2013 resolution and is a statement rather than a measurement.[5]
For converting a specific flight into emissions, one government methodology notes that applying a 1.7 multiplier to the carbon dioxide is applicable to account for the radiative forcing effects of emissions at altitude, and publishes several factor tables labelled as excluding distance and radiative forcing uplifts.[2] That distinction is the reason two honest calculations of the same flight can differ substantially: a per-passenger-kilometre figure may or may not include the uplift, and a figure quoted without stating which is uninterpretable. The per-passenger-kilometre values themselves could not be retrieved for this entry, because they sit in a workbook that could not be opened, so no emissions figure for any flight is published here.
The healthcare side
Healthcare systems have begun accounting for their own emissions, and the boundaries they draw are instructive. One national health service set a target of net zero by 2040 for its own carbon footprint, with an ambition of an 80 per cent reduction by 2028 to 2032, and net zero by 2045 for a wider footprint including its supply chain, with an 80 per cent reduction by 2036 to 2039. The scale of the task was put at removing 6.1 megatonnes of carbon dioxide equivalent from the narrower footprint and 24.9 megatonnes from the wider one.[3]
Within that, patient, visitor, staff and supplier travel contributes around 14 per cent of the system’s total emissions, broken down as 5 per cent for patient travel, 4 per cent for staff commutes and 1 per cent for visitor travel.[3] Those are domestic, road-dominated figures for one country’s health service, and they say nothing about international patients.
The one large patient-travel estimate, and why it does not transfer
One study has estimated the emissions of travel for healthcare at national scale, reporting weighted annual estimated emissions of 35.7 megatonnes of carbon dioxide equivalent with a 95 per cent interval of 27.5 to 43.9 megatonnes. It used a national household travel survey conducted between January 2022 and January 2023 with a response rate of 10.8 per cent, and derived approximate emissions per mile from typical vehicle emissions data.[4]
That is a domestic, private-vehicle estimate built on a household survey of domestic trips, and trips with unreported fuel type were excluded. It is not a medical tourism figure and cannot be scaled into one.
The adjacent gap is documented in the hospital accounting literature itself, which records that patient travel is not always included in hospital assessments, and that patient travel is not explicitly listed in the greenhouse gas protocol.[6] If domestic patient travel sits awkwardly in hospital carbon accounts, an international patient’s flight sits nowhere in them at all.
What is not known
Searches for this entry returned domestic patient-travel studies, general tourism-sector footprints and work on international medical electives, and no estimate of the emissions of cross-border patient travel as a category. That is a search result rather than proof that none exists.
Two arguments are made in this area and neither has been tested here. One is that a long-haul flight for elective surgery adds emissions that treatment at home would not incur. The other is that concentrating specialist procedures in high-volume centres may be more carbon-efficient per procedure than dispersing them, and that a patient who would otherwise make repeated domestic journeys may travel less in total. Both are plausible; neither is measured, and this entry publishes no number for either.
See also
- Medical tourism and sustainable development, the wider policy framing
- Air connectivity and medical tourism, the flights these emissions would come from
- Medical tourism patient flows, how far measured flows actually travel
- Medical tourism statistics, the absent activity data any estimate would need
References
- International Civil Aviation Organization. Global aviation dialogues frequently asked questions. Undated on the page. Verified against primary record: the emissions shares and the 2010 figure were read; the page names no underlying study. Retrieved 9 October 2026.
- United Kingdom Department for Energy Security and Net Zero. 2024 greenhouse gas conversion factors, methodology. 2024. Verified against primary record: the radiative forcing multiplier and the labelling of factor tables were read; the per-passenger-kilometre values sit in a workbook that could not be opened. Retrieved 9 October 2026.
- NHS England. Delivering a net zero National Health Service. October 2020. Verified against primary record: the two footprint definitions, target dates, reduction volumes and travel shares were read. Retrieved 9 October 2026.
- Carbon emissions from patient travel for health care. JAMA Network Open, 2025. Independently reported: peer-reviewed cross-sectional study read; the estimate is domestic and private-vehicle based. Retrieved 9 October 2026.
- United Nations Framework Convention on Climate Change. Submissions from international organizations, document FCCC/SBSTA/2016/MISC.2, 14 May 2016. Verified against primary record: the aviation body’s submission was read, reproducing the preamble of a 2013 assembly resolution. Retrieved 9 October 2026.
- Jett et al. Hospital carbon footprint assessment. Frontiers in Health Services, 2025;5:1675827, published 20 October 2025. Independently reported: peer-reviewed paper read for its statements on the treatment of patient travel in hospital accounts. Retrieved 9 October 2026.
Sourcing note: the aviation body page, the treaty document, the government methodology, the health system plan and the two studies were opened and read on 9 October 2026. No emissions figure for any individual flight is published, because the per-passenger-kilometre factors sit in a workbook that could not be opened and because a figure quoted without stating whether the altitude uplift is included cannot be interpreted. No estimate of medical travel emissions was located, and that is reported as a search result. The aviation shares and the health system travel shares are not medical tourism figures and are labelled accordingly. The two arguments set out at the end are hypotheses, not findings.